Example to browse
Report example: Q3 quarterly report to the advisory board
When a board wants to read the numbers and prepare a decision.
Free: 1 document, plan up to 12 pages, first 3 built, no credit card. Plans from €7.99/mo
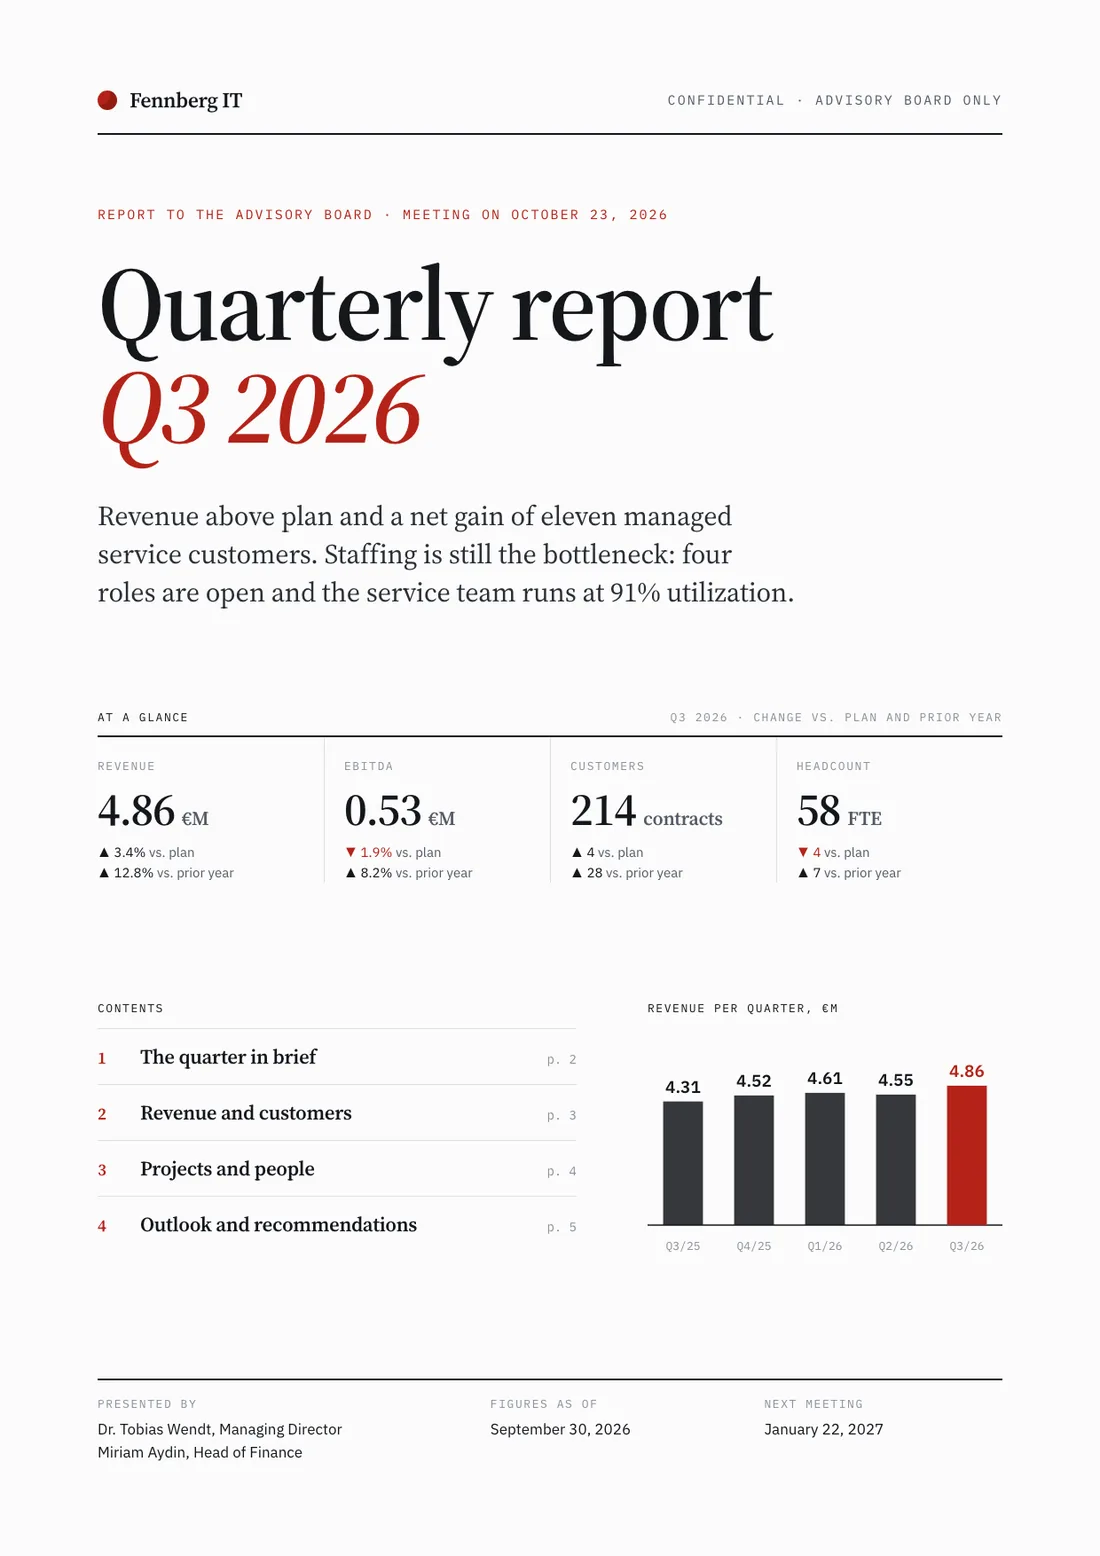
Example report for a fictional company. Names and numbers are sample valuesSee all 5 pages
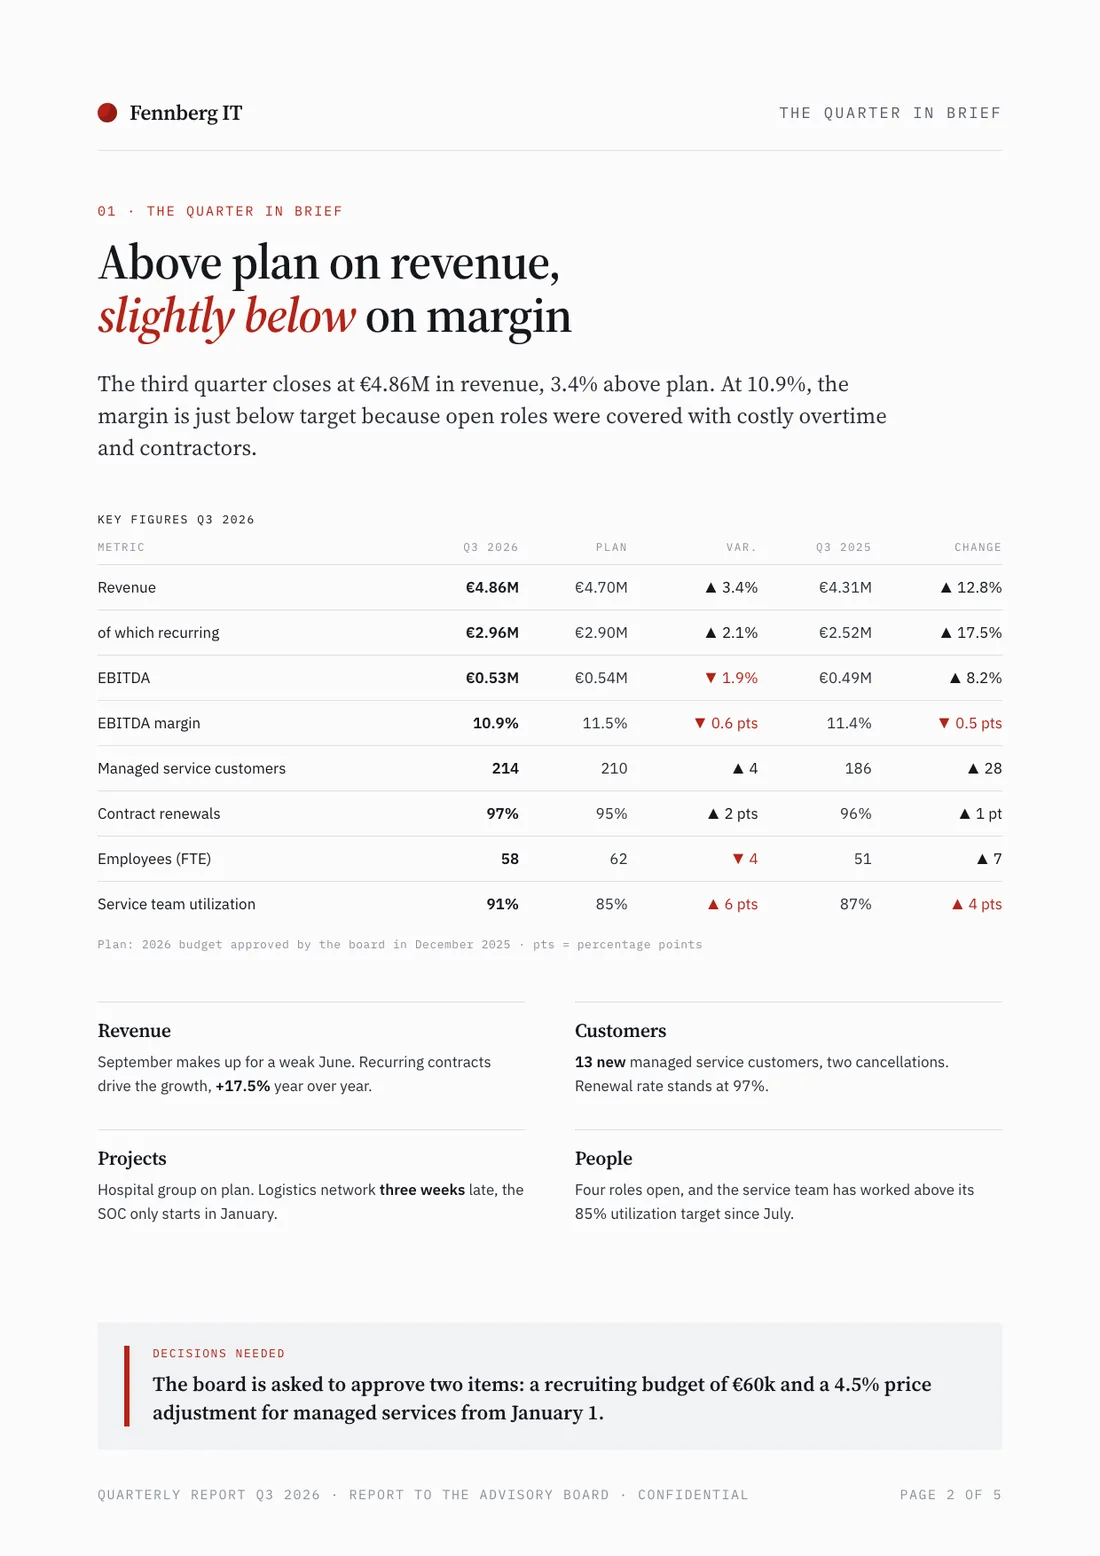
A report is something you look things up in, not read from start to finish. That is why the summary comes first: KPIs against plan and prior year, the key messages and what has to be decided. This example is a quarterly report for an advisory board on five pages, designed for a fictional IT company.
All 5 pages at a glance
Click an image to see it large. Companies, people and figures are made up. The example is designed by hand and not generated by Slaide.
Example report for a fictional company. Names and numbers are sample values
How it is built
What you see page by page.
| Page | What you see |
|---|---|
| 1Cover | Fennberg IT quarterly report Q3 2026 to the advisory board with key figures at a glance |
| 2Summary | Q3 key figures table against plan and prior year, four key points and decisions needed |
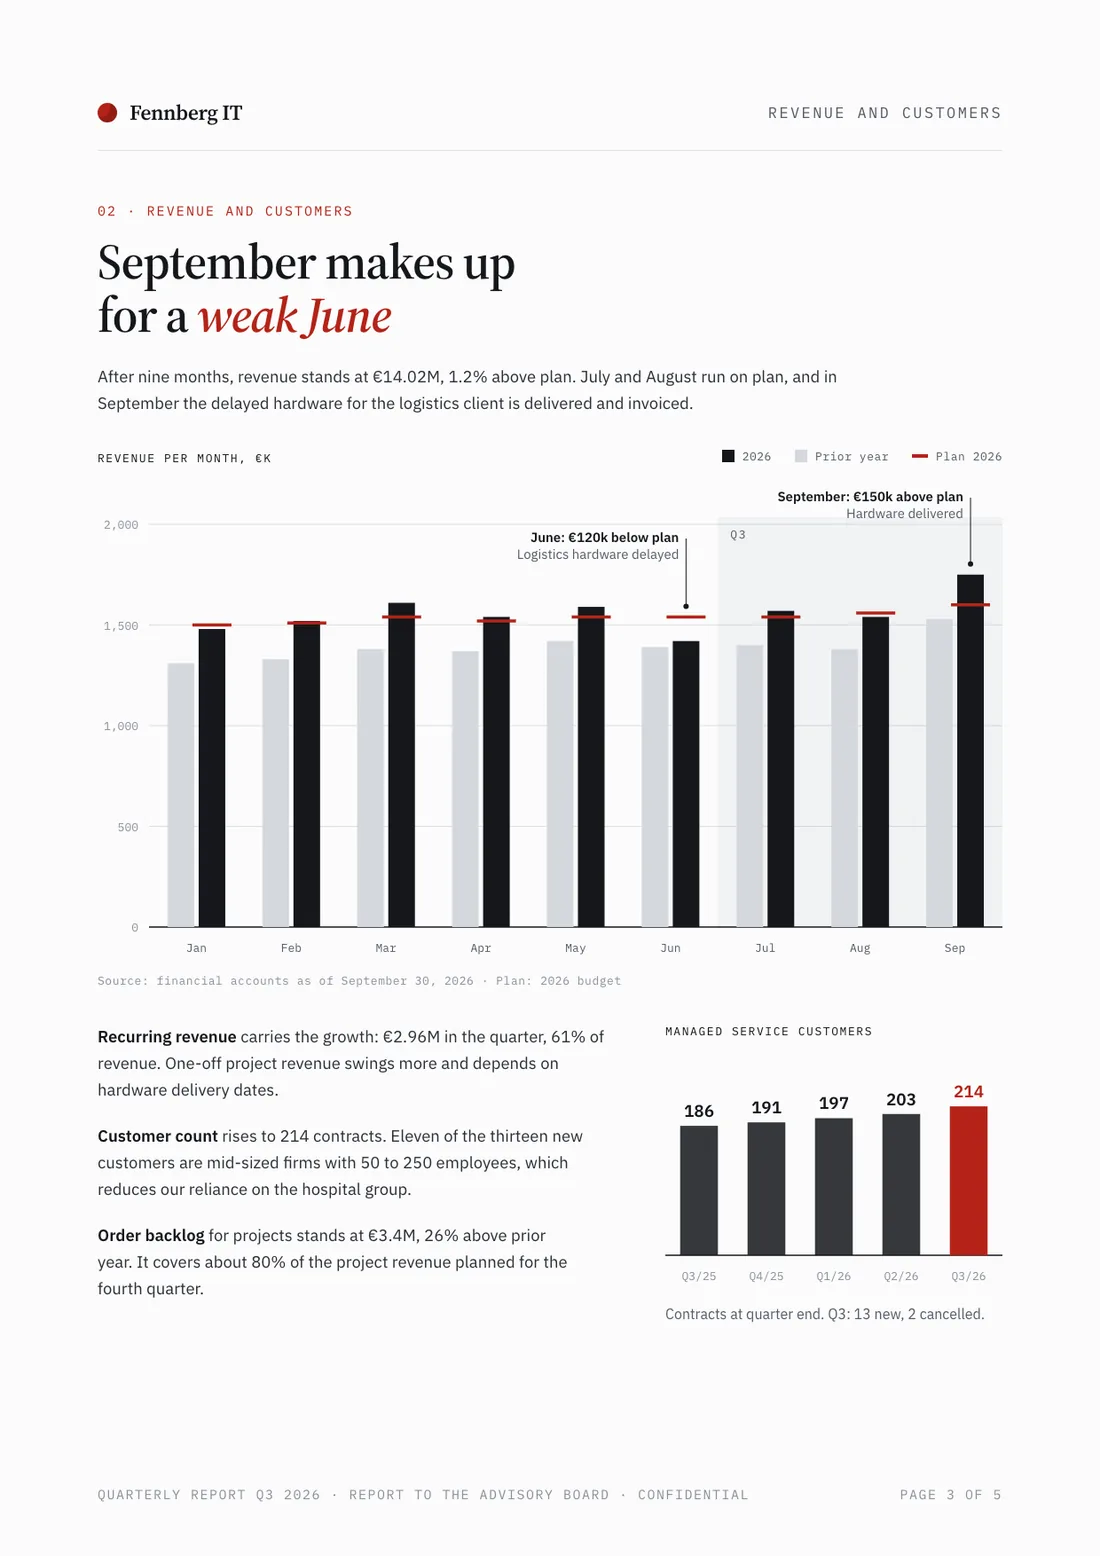
| 3Revenue and customers | Bar chart of monthly revenue against plan and prior year, plus the trend in customer count |
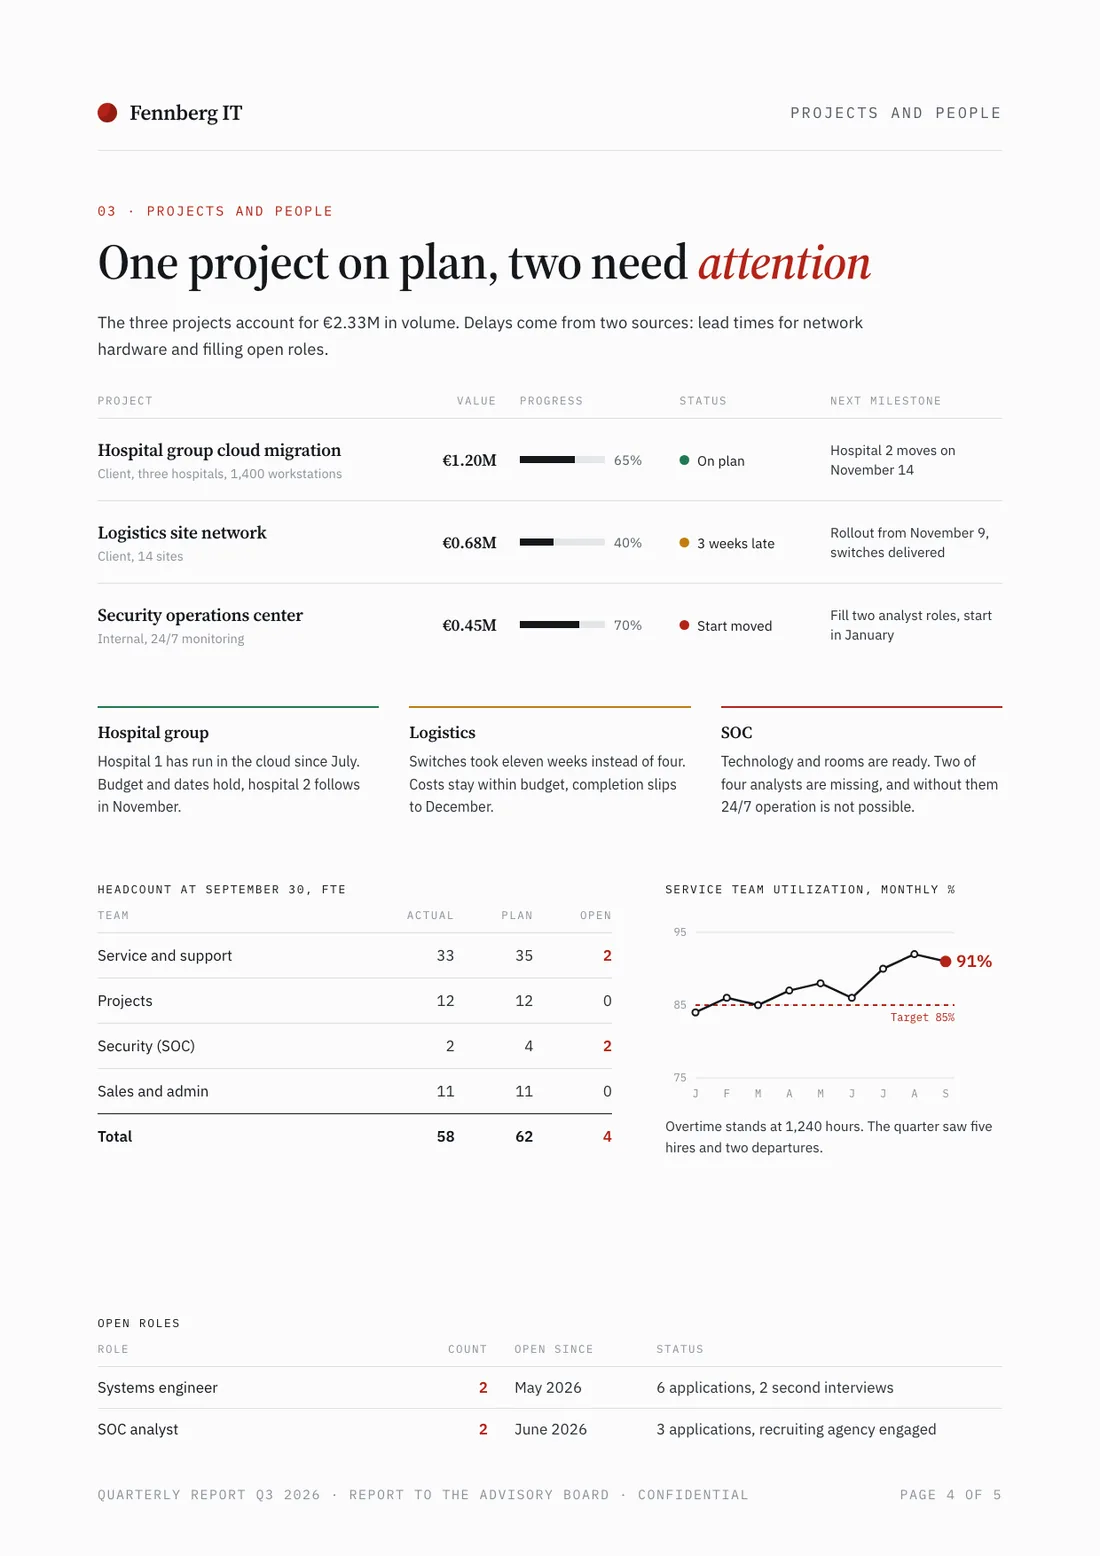
| 4Projects and people | Table of the three key projects with status, a comment on each and headcount by team |
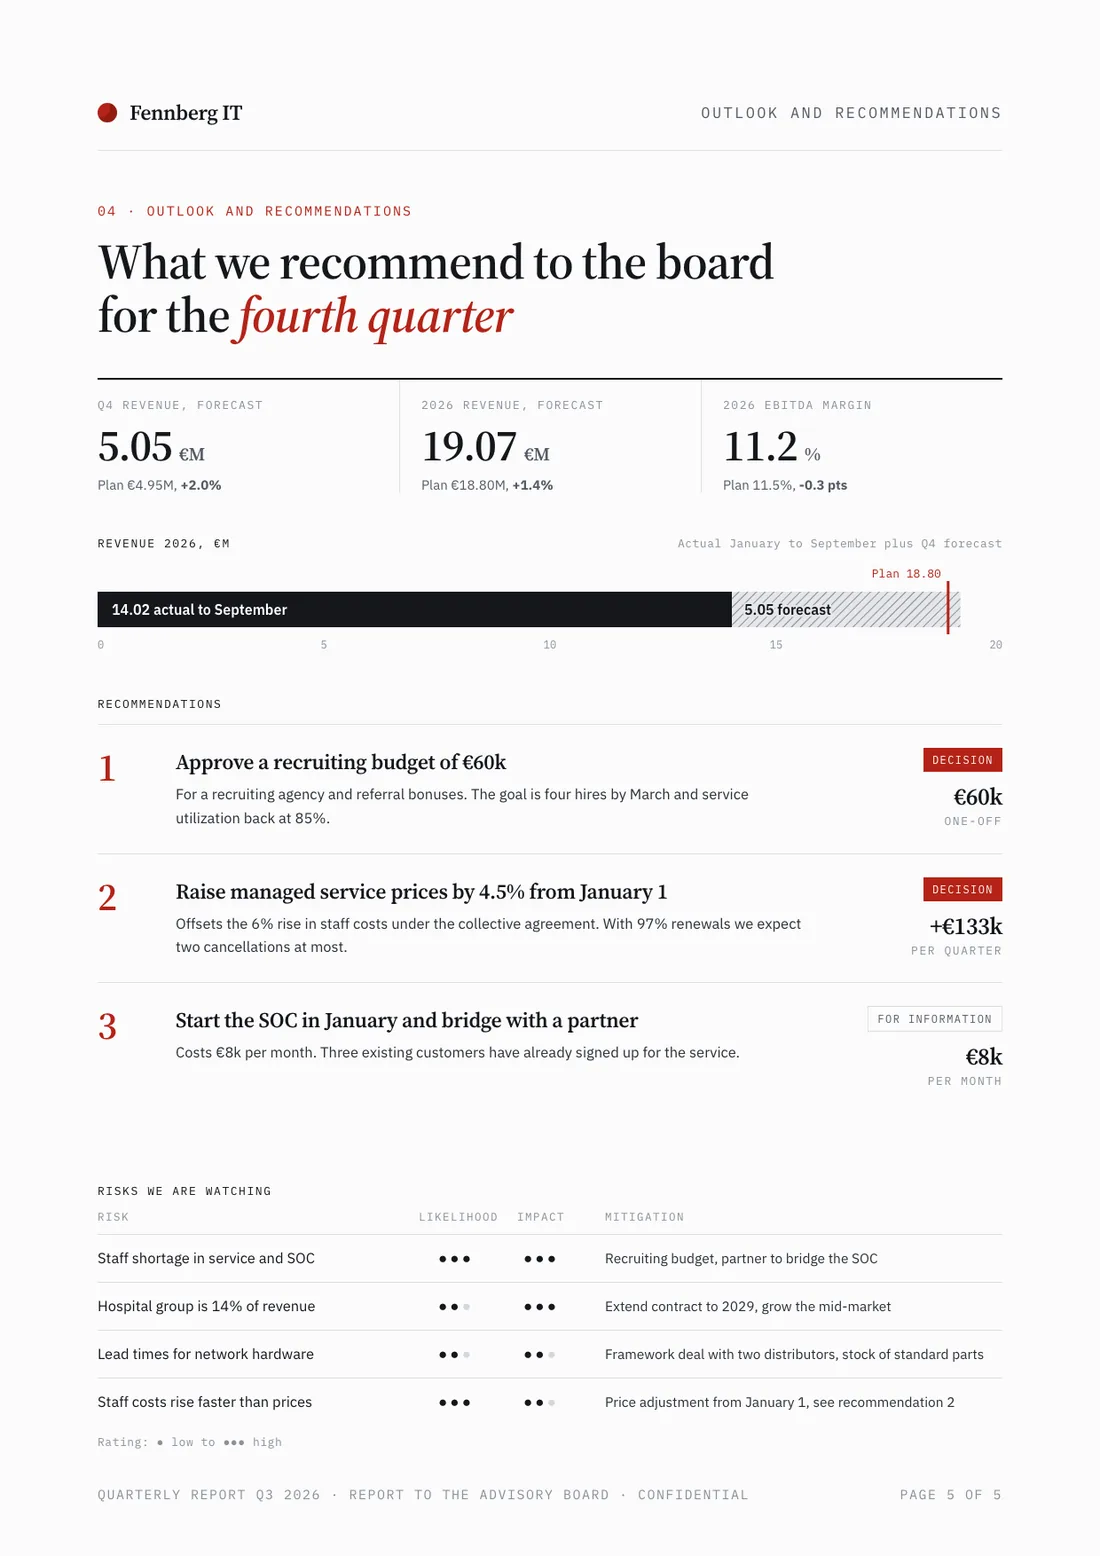
| 5Recommendations | Q4 and full-year forecast, three recommendations to the board and a risk table |
What this example does well
Techniques you can take over, visible in the images above.
What you need beforehand
To make your own document just as concrete, have this ready.
Common mistakes when you rebuild it
What to watch for.
A starting point for your own document
Create a quarterly report for the advisory board as a document: summary with KPI table, revenue and customers with a chart, projects and people, outlook with recommendations and risks. As an A4 document. My company and my figures:
FAQ
Anything missing? Ask us
What belongs in a quarterly report?
A summary with KPIs, the trend in revenue and customers, projects and people, and an outlook with recommendations and risks. This example has exactly those parts on five pages.
Should a report be a document or a presentation?
What is read and filed is a document. What is presented is a deck. This example is a document in A4 format. The presentation example shows the same kind of content as slides.
How do I create a report like this with Slaide?
Give figures and bullet points or upload a spreadsheet. Slaide structures the report, builds tables and charts and delivers a document you can edit and export as PDF or Word. The AI Report Generator page shows the steps.
Was this example made with Slaide?
No. It is designed by hand for a fictional company with sample figures, so you can see what a good structure looks like. What Slaide builds from your content looks different: it comes from your figures and goals, and you adjust every page.
Your content becomes your document
Describe what you need and add your files. The free plan builds the first 3 pages of one document, no credit card.