Example to browse
Presentation example: Q3 sales review for the management board
When a management board should see the numbers and make decisions in 30 minutes.
Free: 1 document, plan up to 12 pages, first 3 built, no credit card. Plans from €7.99/mo

Example presentation for a fictional company. Names and numbers are sample valuesSee all 8 slides
A good presentation for a management board says first what must be decided, then shows the numbers, and ends with approvals. This example is a Q3 sales review on eight slides, designed for a fictional measurement-technology manufacturer. The company and all figures are made up.
All 8 slides at a glance
Click an image to see it large. Companies, people and figures are made up. The example is designed by hand and not generated by Slaide.
How it is built
What you see slide by slide.
| Slide | What you see |
|---|---|
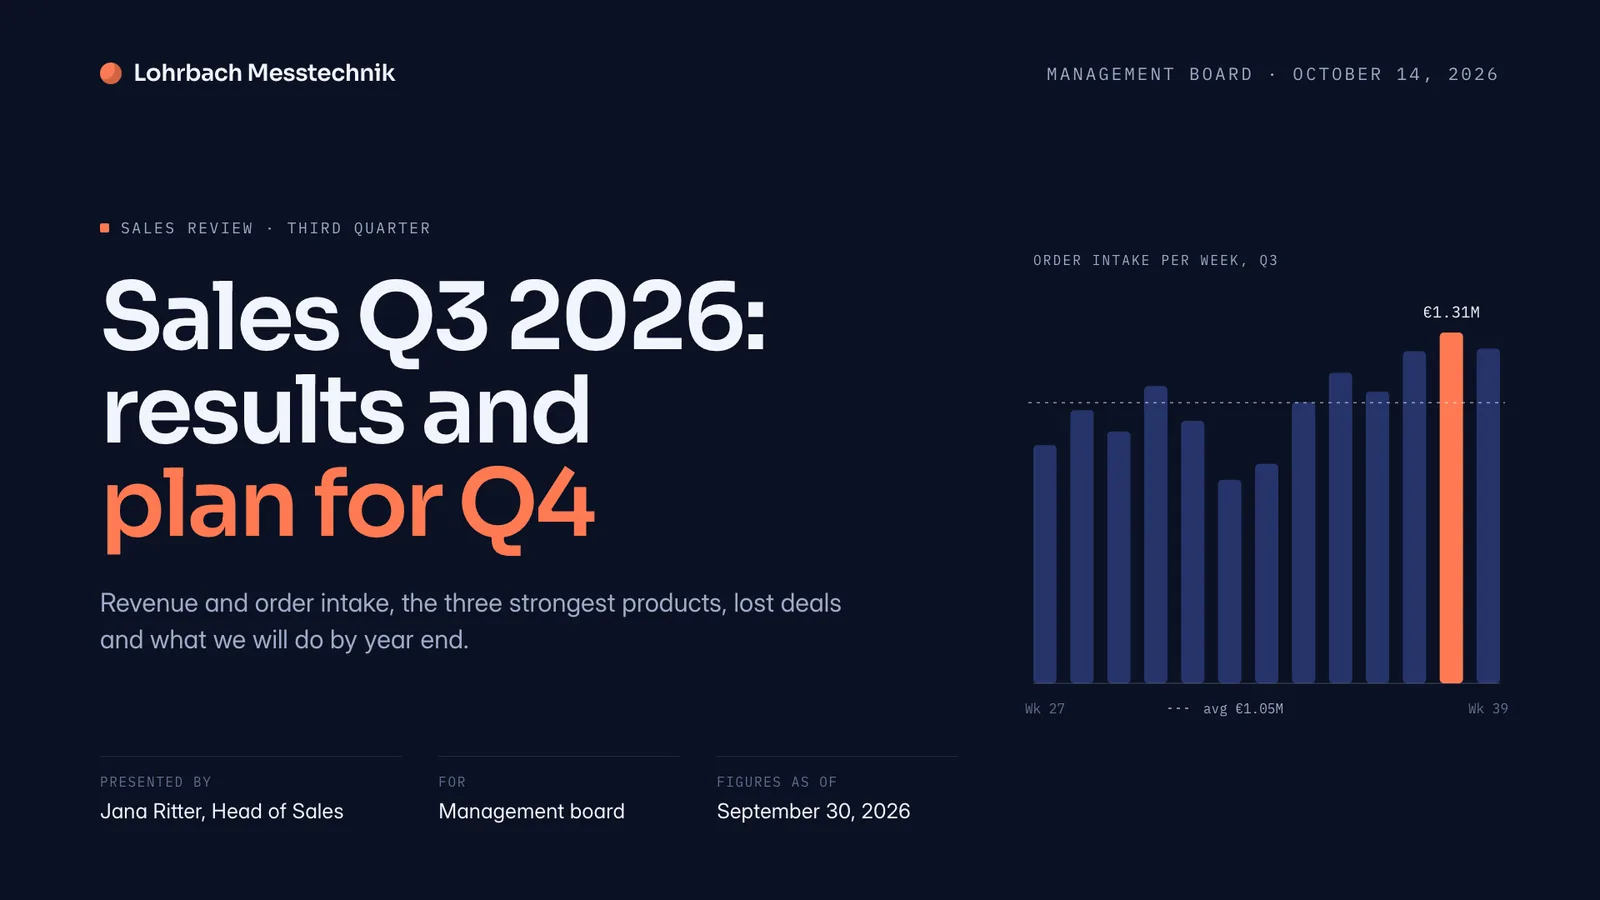
| 1Title | Q3 2026 sales review of Lohrbach Messtechnik with a bar chart of weekly order intake |
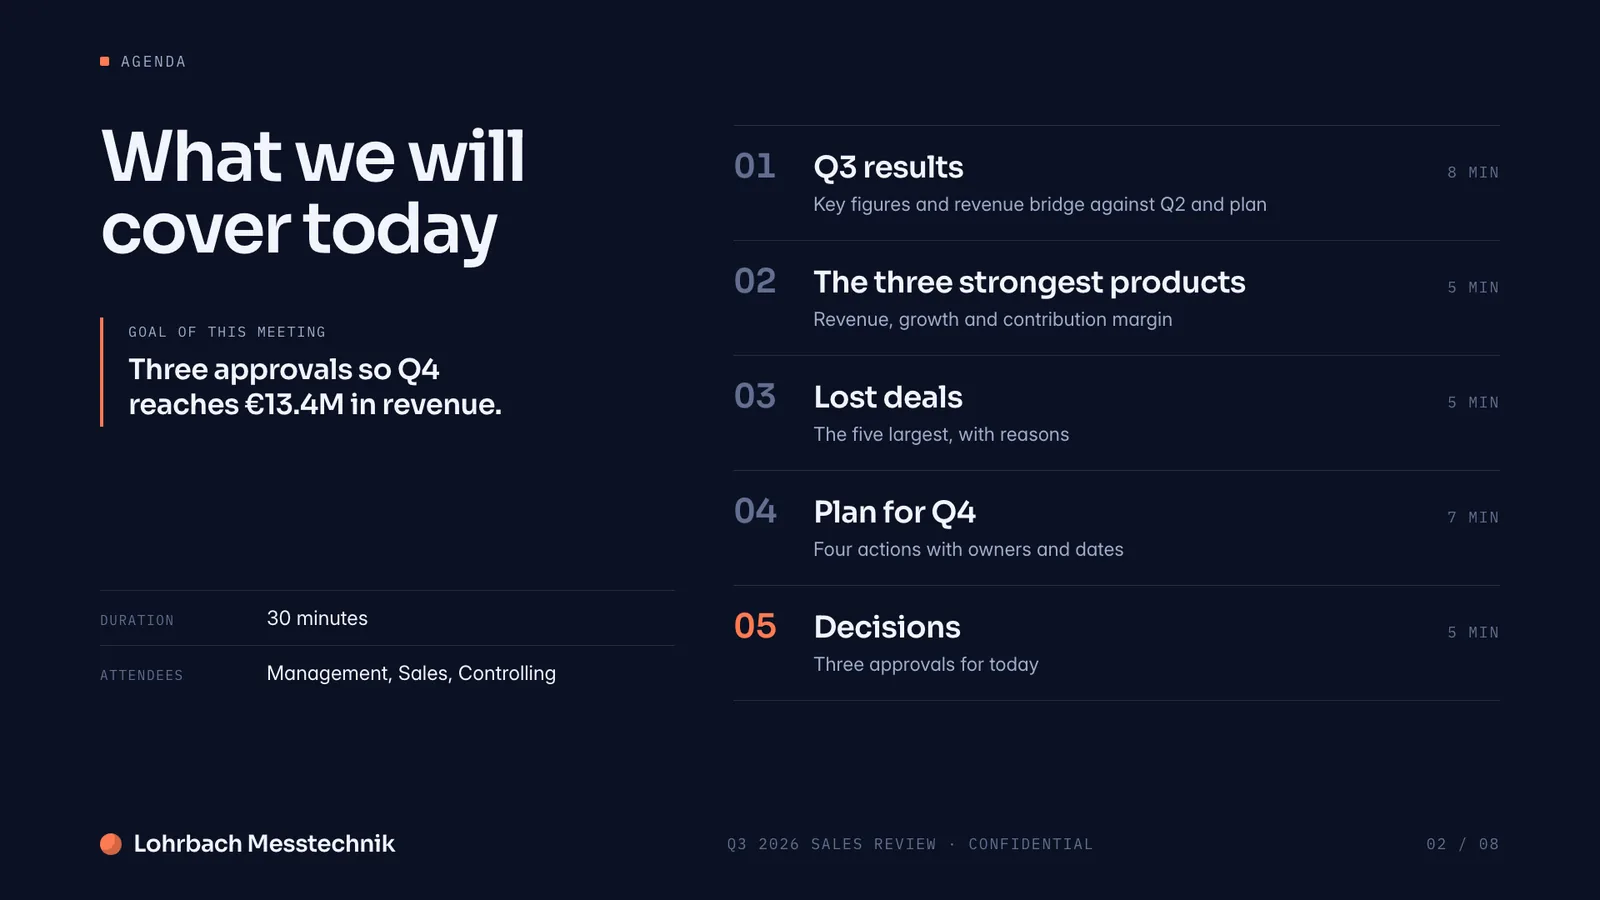
| 2Agenda | Five items with time slots and the goal of the meeting |
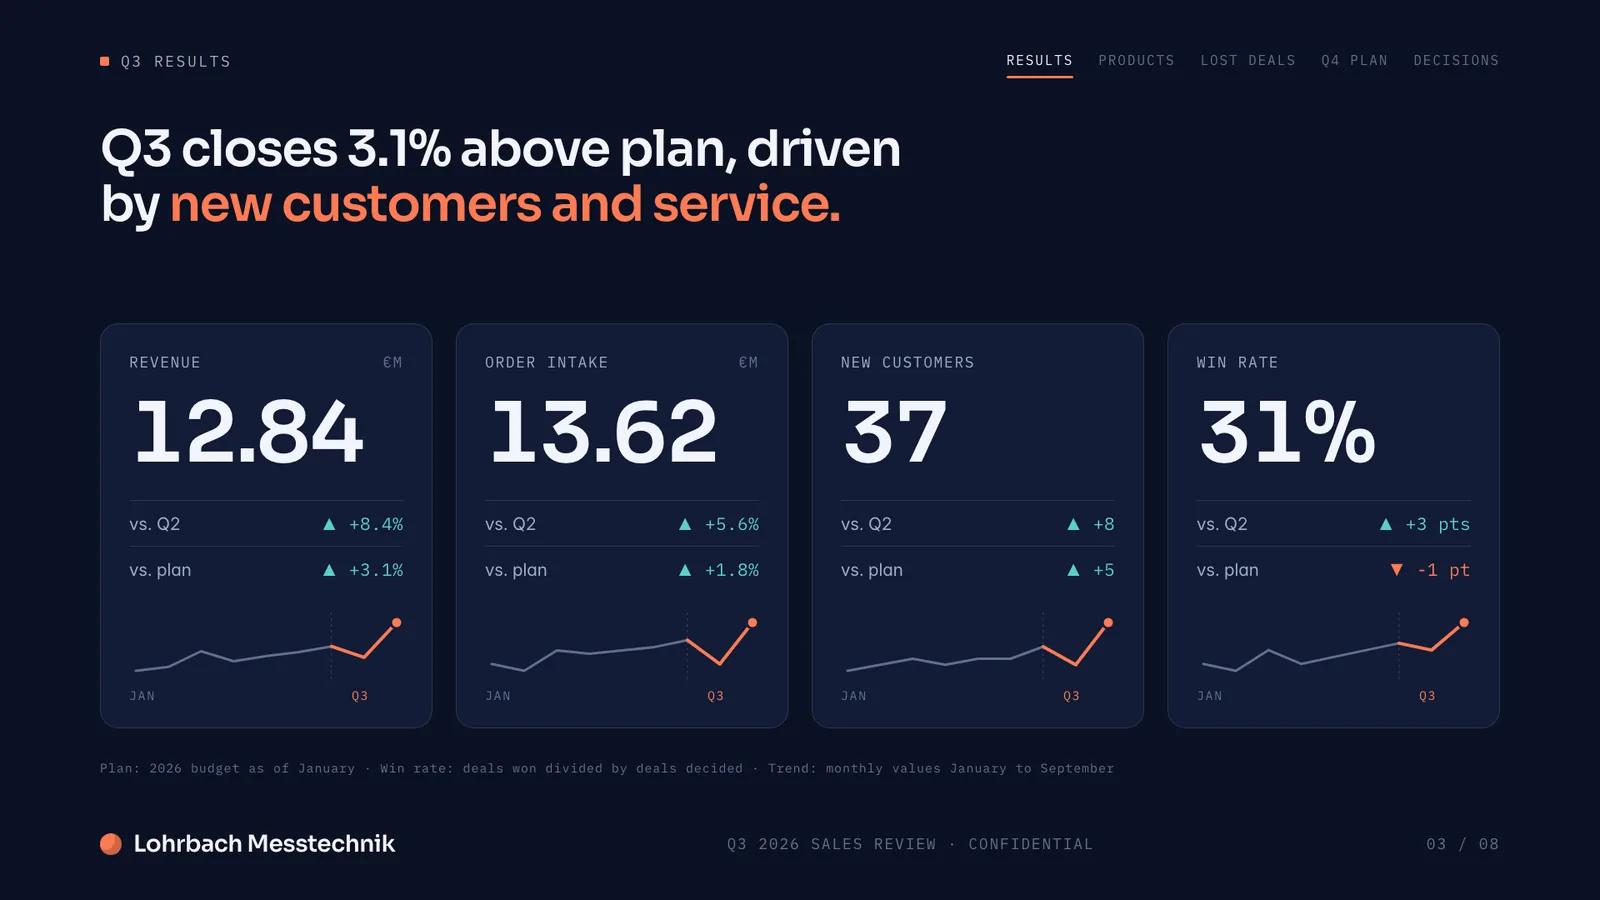
| 3Key figures | Revenue, order intake, new customers and win rate against last quarter and plan |
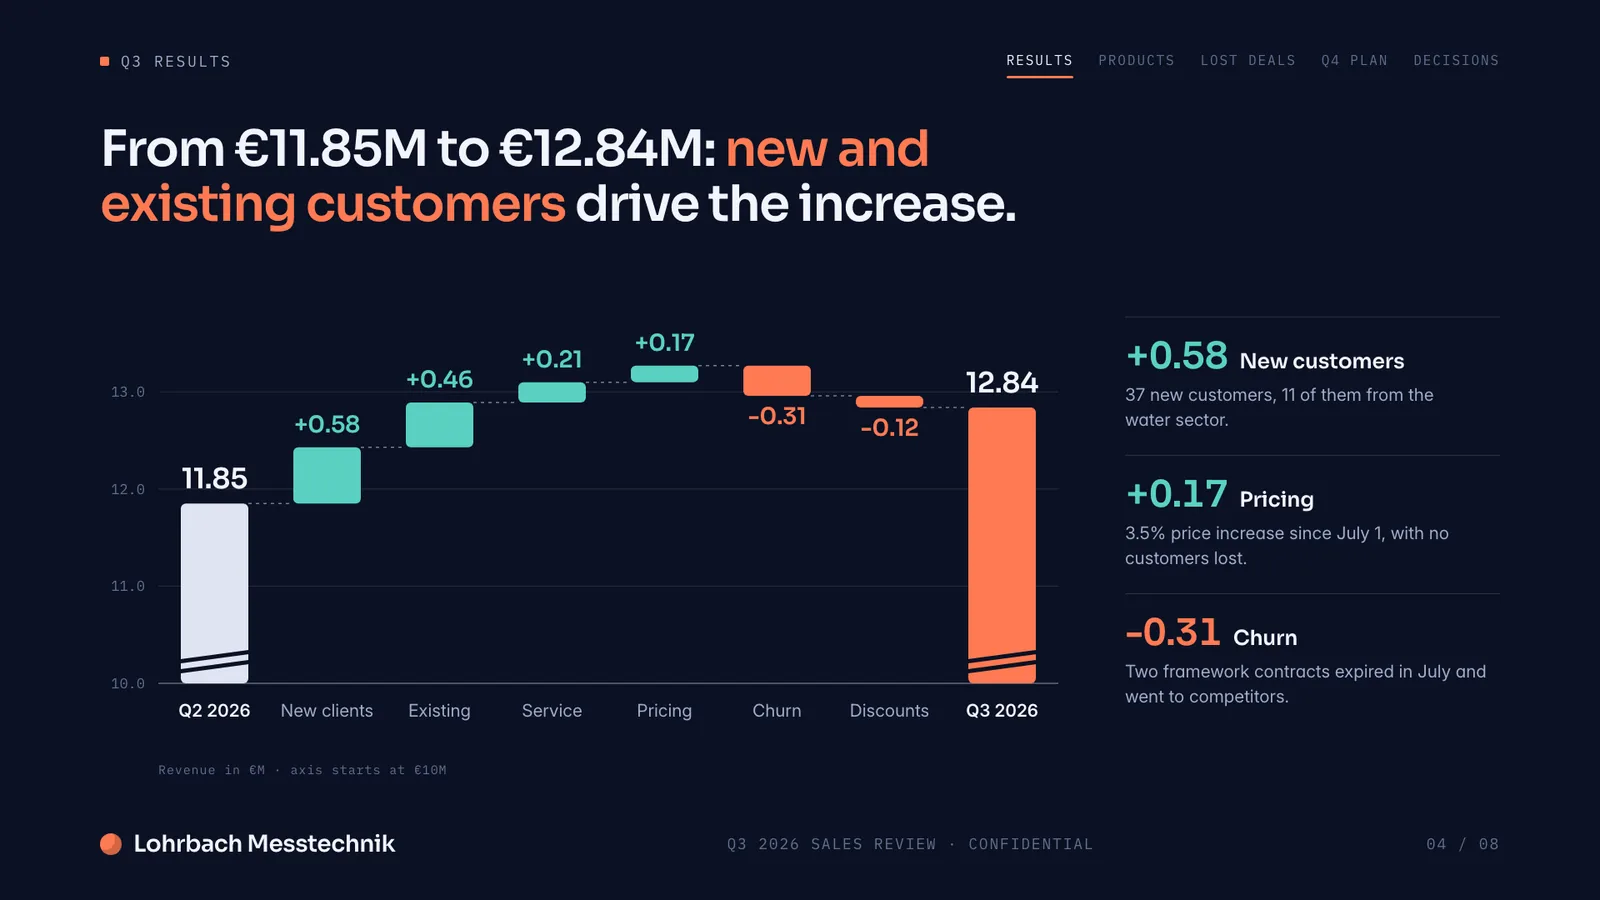
| 4Revenue bridge | Bridge chart from €11.85M in Q2 to €12.84M in Q3 |
| 5Products | The three strongest products with revenue, growth and share of total revenue |
| 6Lost deals | Table of the five largest lost deals with value, reason and consequence |
| 7Q4 plan | Timeline with four actions, owners and milestones from October to December |
| 8Decisions | Three approvals with budget and the next steps with dates |
What this example does well
Techniques you can take over, visible in the images above.
What you need beforehand
To make your own document just as concrete, have this ready.
Common mistakes when you rebuild it
What to watch for.
A starting point for your own document
Create a presentation for management with last quarter's sales review: agenda, KPIs against the previous quarter and plan, revenue bridge, strongest products, lost deals with reason, plan for next quarter and decisions. My figures:
FAQ
Anything missing? Ask us
How do I structure a presentation for management?
Agenda with the goal, KPIs, the explanation of the biggest variance, wins and losses, the plan for next quarter and decisions. This example follows that order.
How many slides do I need for 30 minutes?
As a rule of thumb, eight to ten: count on two to three minutes a slide and leave room for questions. This example has eight.
How do I make a presentation like this with Slaide?
Give Slaide your KPIs and the occasion, or upload your spreadsheet. It plans the slides and builds charts such as the revenue bridge. The AI Presentation Maker page shows the steps.
Was this example made with Slaide?
No. It is designed by hand for a fictional company with sample figures, so you can see what a good structure looks like. What Slaide builds from your content looks different: it comes from your figures and goals, and you adjust every page.
Your content becomes your document
Describe what you need and add your files. The free plan builds the first 3 pages of one document, no credit card.